JC: hypothalamic neurons respond to observed aggression?
11 Apr 2023 | by bartulem
Yang et al. Cell (2023) piqued my interest by combining two engaging scientific motifs in their work: hypothalamic ensemble dynamics in the context of observing social behavior. On one hand, our lab has been at the forefront of efforts to dissect contributions of different nodes of the social behavior network in the control of behaviors like aggression (see comprehensive publication list). Aggression, broadly speaking, is societally relevant, has recognizable behavioral signatures across vertebrate taxa, and can conveniently be probed by mammalian model organisms, such as mice. The thus-far-uncovered neuronal dynamics underlying this primal form of behavior are genuinely absorbing, likely involving approximate line attractors encoding aggressive states, as recently published by Nair et al., Cell (2023), so I encourage you to read more on the subject elsewhere.
On the other hand, the work produced by my graduate lab was invested in understanding the differences between cortical implementation of enacted and observed behaviors in mice, or their conjunction, as in the case of mirror neurons, i.e., cortical cells that fire both when a behavior is performed, as well as when it is just observed, a phenomenon studied primarily in primates (Fig. 1A). Yang et al. targeted VMHvlPR neurons with fiber photometry in 14 PRCre male mice and compared response profiles of bulk Ca2+ activity across performance/observation conditions (Fig. 1B). Although the nature of the measured neural responses was distinct (single-unit for monkey, and VMHvlPR bulk activity for mouse recordings), the trial-averaged mouse data mimicked that of the primate, with the observation-evoked activity generally lower in magnitude relative to that during performance. It is important to note, however, that the Yang et al. observation data is characterized by noisier event-aligned single-trial dynamics, where several trials exhibit a relatively large fractional increase in fluorescence, while others ostensibly exhibit almost no change at all (Fig. 1B, red circles). This is not dissimilar to the performance condition, but is still potentially concerning given the low amount of trial repetitions in total (7 or 9 trials for one representative male, for attack and tail-rattling behaviors, respectively), which could, as such, allow computed averages to be affected by extreme values from just one or two trials (a case in point is Fig. 1C, red circles). In essence, there is no reason more stringent analyses should not be performed on this dataset to ensure consistency: e.g., splitting the data in half and computing stability metrics or shuffling data to establish false positive rates would alleviate some of such concerns.
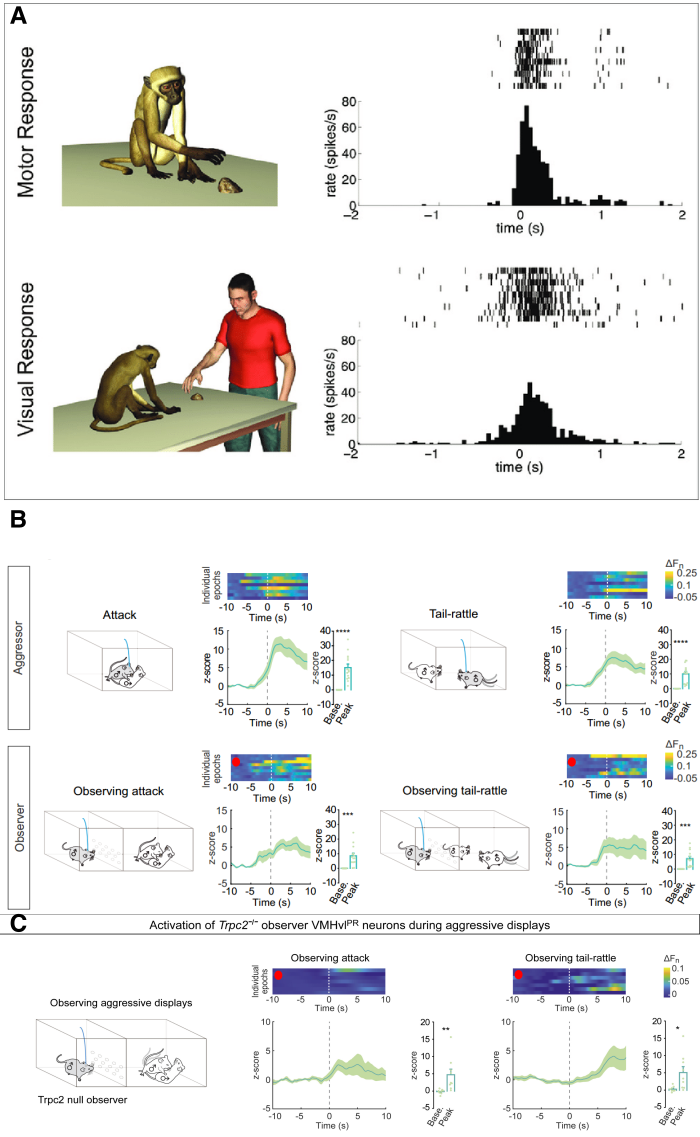
It is also relevant to point out that Yang et al. use different metrics to evaluate activity changes across single trials versus the trial-average condition. Although this choice was not justified further in writing, I assume the latter method was used out of convenience in summarizing results over animals, but in principle could have been used in the former case, too. Nevertheless, in case of the former, raw fluorescence signals were first normalized by fluorescence in a 5-minute “baseline” recording (conducted prior to any behavioral tests), and then for each time bin in the peri-event period (event ±10 seconds) relative fluorescence change was computed as ΔFn=(Ft-F0)/F0, where F0 was the median fluorescence in the -10:-5 time window. Alternatively, for trial-averaged data, the authors opted to compute z-scores based on the mean and standard deviation of the baseline-normalized fluorescence signal in the -10:-5 time window, averaged over individual epochs and finally across mice. Interestingly, the final comparisons were made between the -10:-5 baseline epoch, and the 95% percentile peak fluorescence in the 0:10 epoch (following event onset). I find the last choice unusual, given the temporal discrepancy between compared epochs, not least because I believe there are important distinctions between claims that neuronal populations encode behaviors and those that neuronal populations encode variable segments of the same behaviors. The latter claim, at the very least, invites further explorations of what induces such variability.
However, the most disappointing aspect of this research was the amount of attention to detail devoted to behavior itself. When making claims about ensemble responses to observed behaviors, it is important to demonstrate that the observing mouse is not passively trying to enact any demonstrated behaviors. Yang et al. give us a flavor of how single-trial activity dynamics unfold in parallel to unfolding behavior, revealing fairly tight correspondence between performed and demonstrated sequences of actions (Fig. 2A). In this particular plot, an extra column would have been a welcome addition, one showing the observer trace aligned not to demonstrated, but also to self-expressed behaviors during observation. To address this more directly, authors show that, on average, observers exhibit tail-rattling levels comparable to Trpc2-/- (i.e., males null for a cation channel essential for pheromone sensing, which lack aggressive behaviors in their phenotype) controls, in any circumstance significantly lower to that of demonstrator mice (Fig. 2B). Although such trial-averaged comparisons are meaningful, behavioral trial dynamics (as shown in Fig. 2A) dictate a closer look: it is still possible that, even though on average such differences persist, observer mice move little but enough to evoke activity during demonstrated actions. This is explicitly ruled out as a possibility by the authors by invoking data not presented in the paper, and claiming the activity coincided with demonstrator displays of aggression, and not the few intermittent tail-rattles performed by the observers.
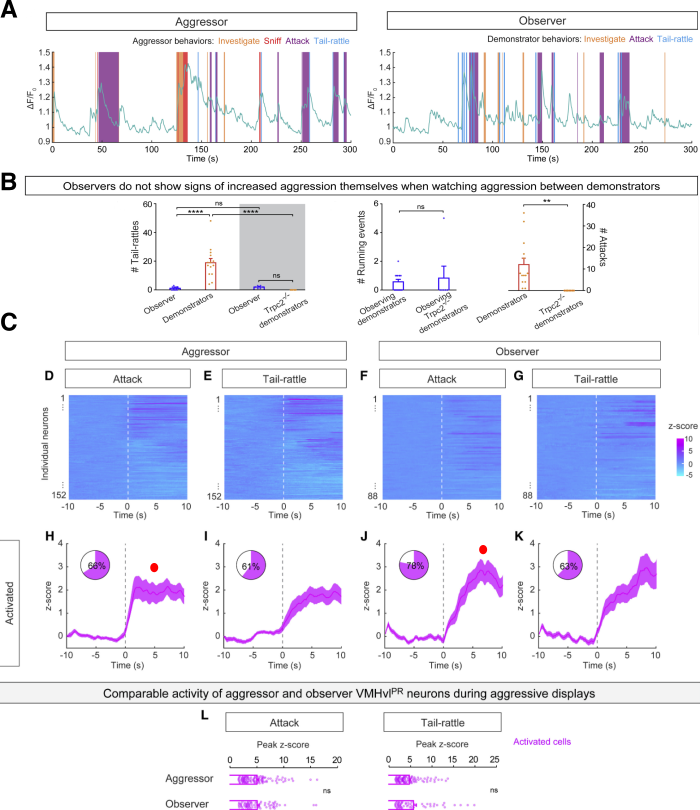
The authors then switch to one-photon imaging to record from individual GCaMP6s-labeled VMHvlPR neurons. They report ensembles that are excited, and those that are inhibited by action observation, but surprisingly there are no differences in peak amplitude of activity recorded across conditions, with trial averaged data exhibiting slightly higher activity in the observation condition (Fig. 2C, red circles), a finding uncharacteristic of original mirror neuron studies (Fig. 1A) and the fiber photometry results (Fig. 1B). The authors attribute this to the fact that photometry likely captures fluorescence changes from multiple cellular compartments, while one-photon imaging was restricted to the soma. I wonder whether this finding has more to do with the notion that different individual neurons might encode aggression-seeking, rather than aggression itself, a propensity likelier to emerge in monitoring individual neurons, rather than ensembles. It is also interesting that peak ensemble-averaged activity only exceeds two in the performance, and rarely exceeds three standard deviations relative to baseline in the observation condition (Fig. 2C, red circles). To conclude this brief methodological critique, Yang et al. provide us with an interesting dataset aimed at understanding observation-related responses in nuclei situated deep in the brain. Here I focused on segments of this study that could be upgraded in future renditions, mainly with more stringent analyses.